Independent grid code testing · For global utilities, IPPs and OEMs
Home/ Behind the Grid/ Field methodology/ Inrush current measurement

Inrush current measurement: 15 seconds, 16 samples per cycle, and the recorder most projects don't have.

First energization of a generator step-up transformer is the one moment in a plant's life where the regulator needs millisecond-grade evidence. Get the recorder spec wrong and you re-do the test under far more expensive conditions.

Three-phase inrush waveform across the codified 15-second window
Representative GCE engagement · Phase C peak 2,800 A · Phase A peak 1,131 A · Asymmetric per-phase decay over the codified 15-second window

Most grid code tests can be repeated. A poorly captured AVR step test? Run it again next shift. A speed-droop measurement that didn't settle cleanly? Repeat after lunch.

The inrush current measurement at first energization of the generator step-up transformer (GSU) is different. The transformer is energized exactly once from the de-energized cold state. Every subsequent energization carries residual flux, different ambient conditions, and (often) different system impedance behind the breaker as more of the plant comes online. If the recorder didn't capture the first event correctly, what you can re-measure later is no longer the first event.

This is the test where the most experienced engineer on the project should be the one watching the recorder.

What the data actually looks like — from a recent engagement

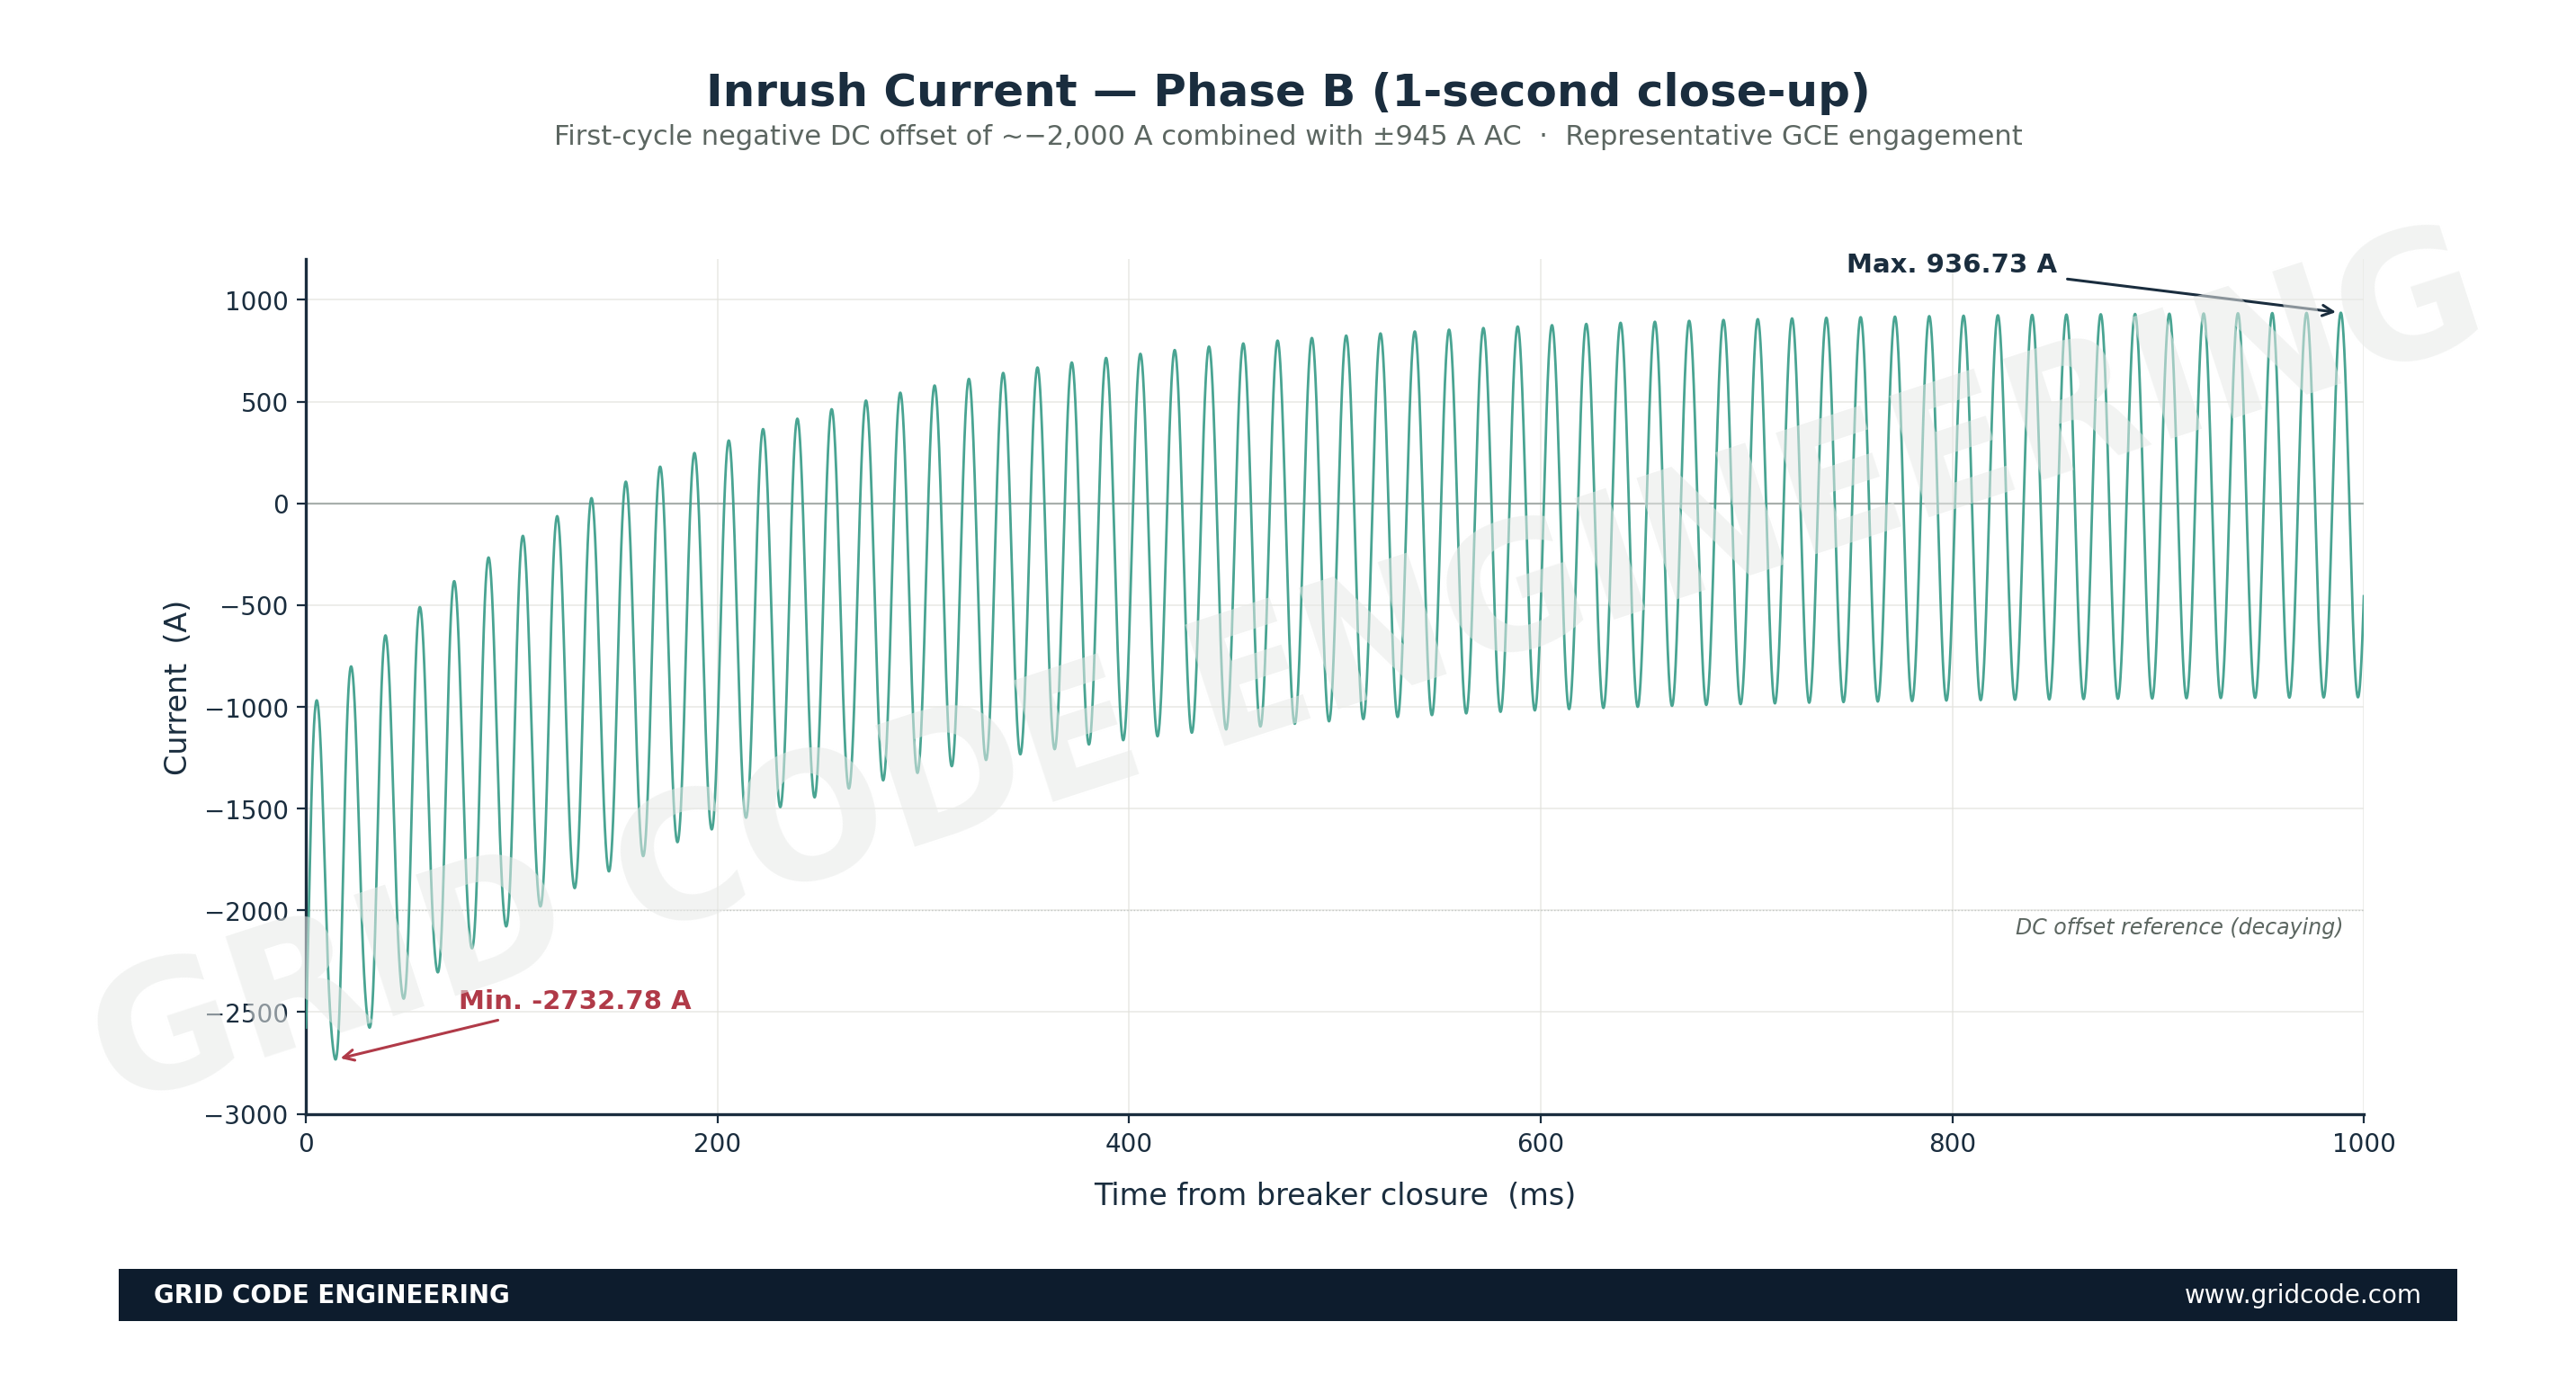
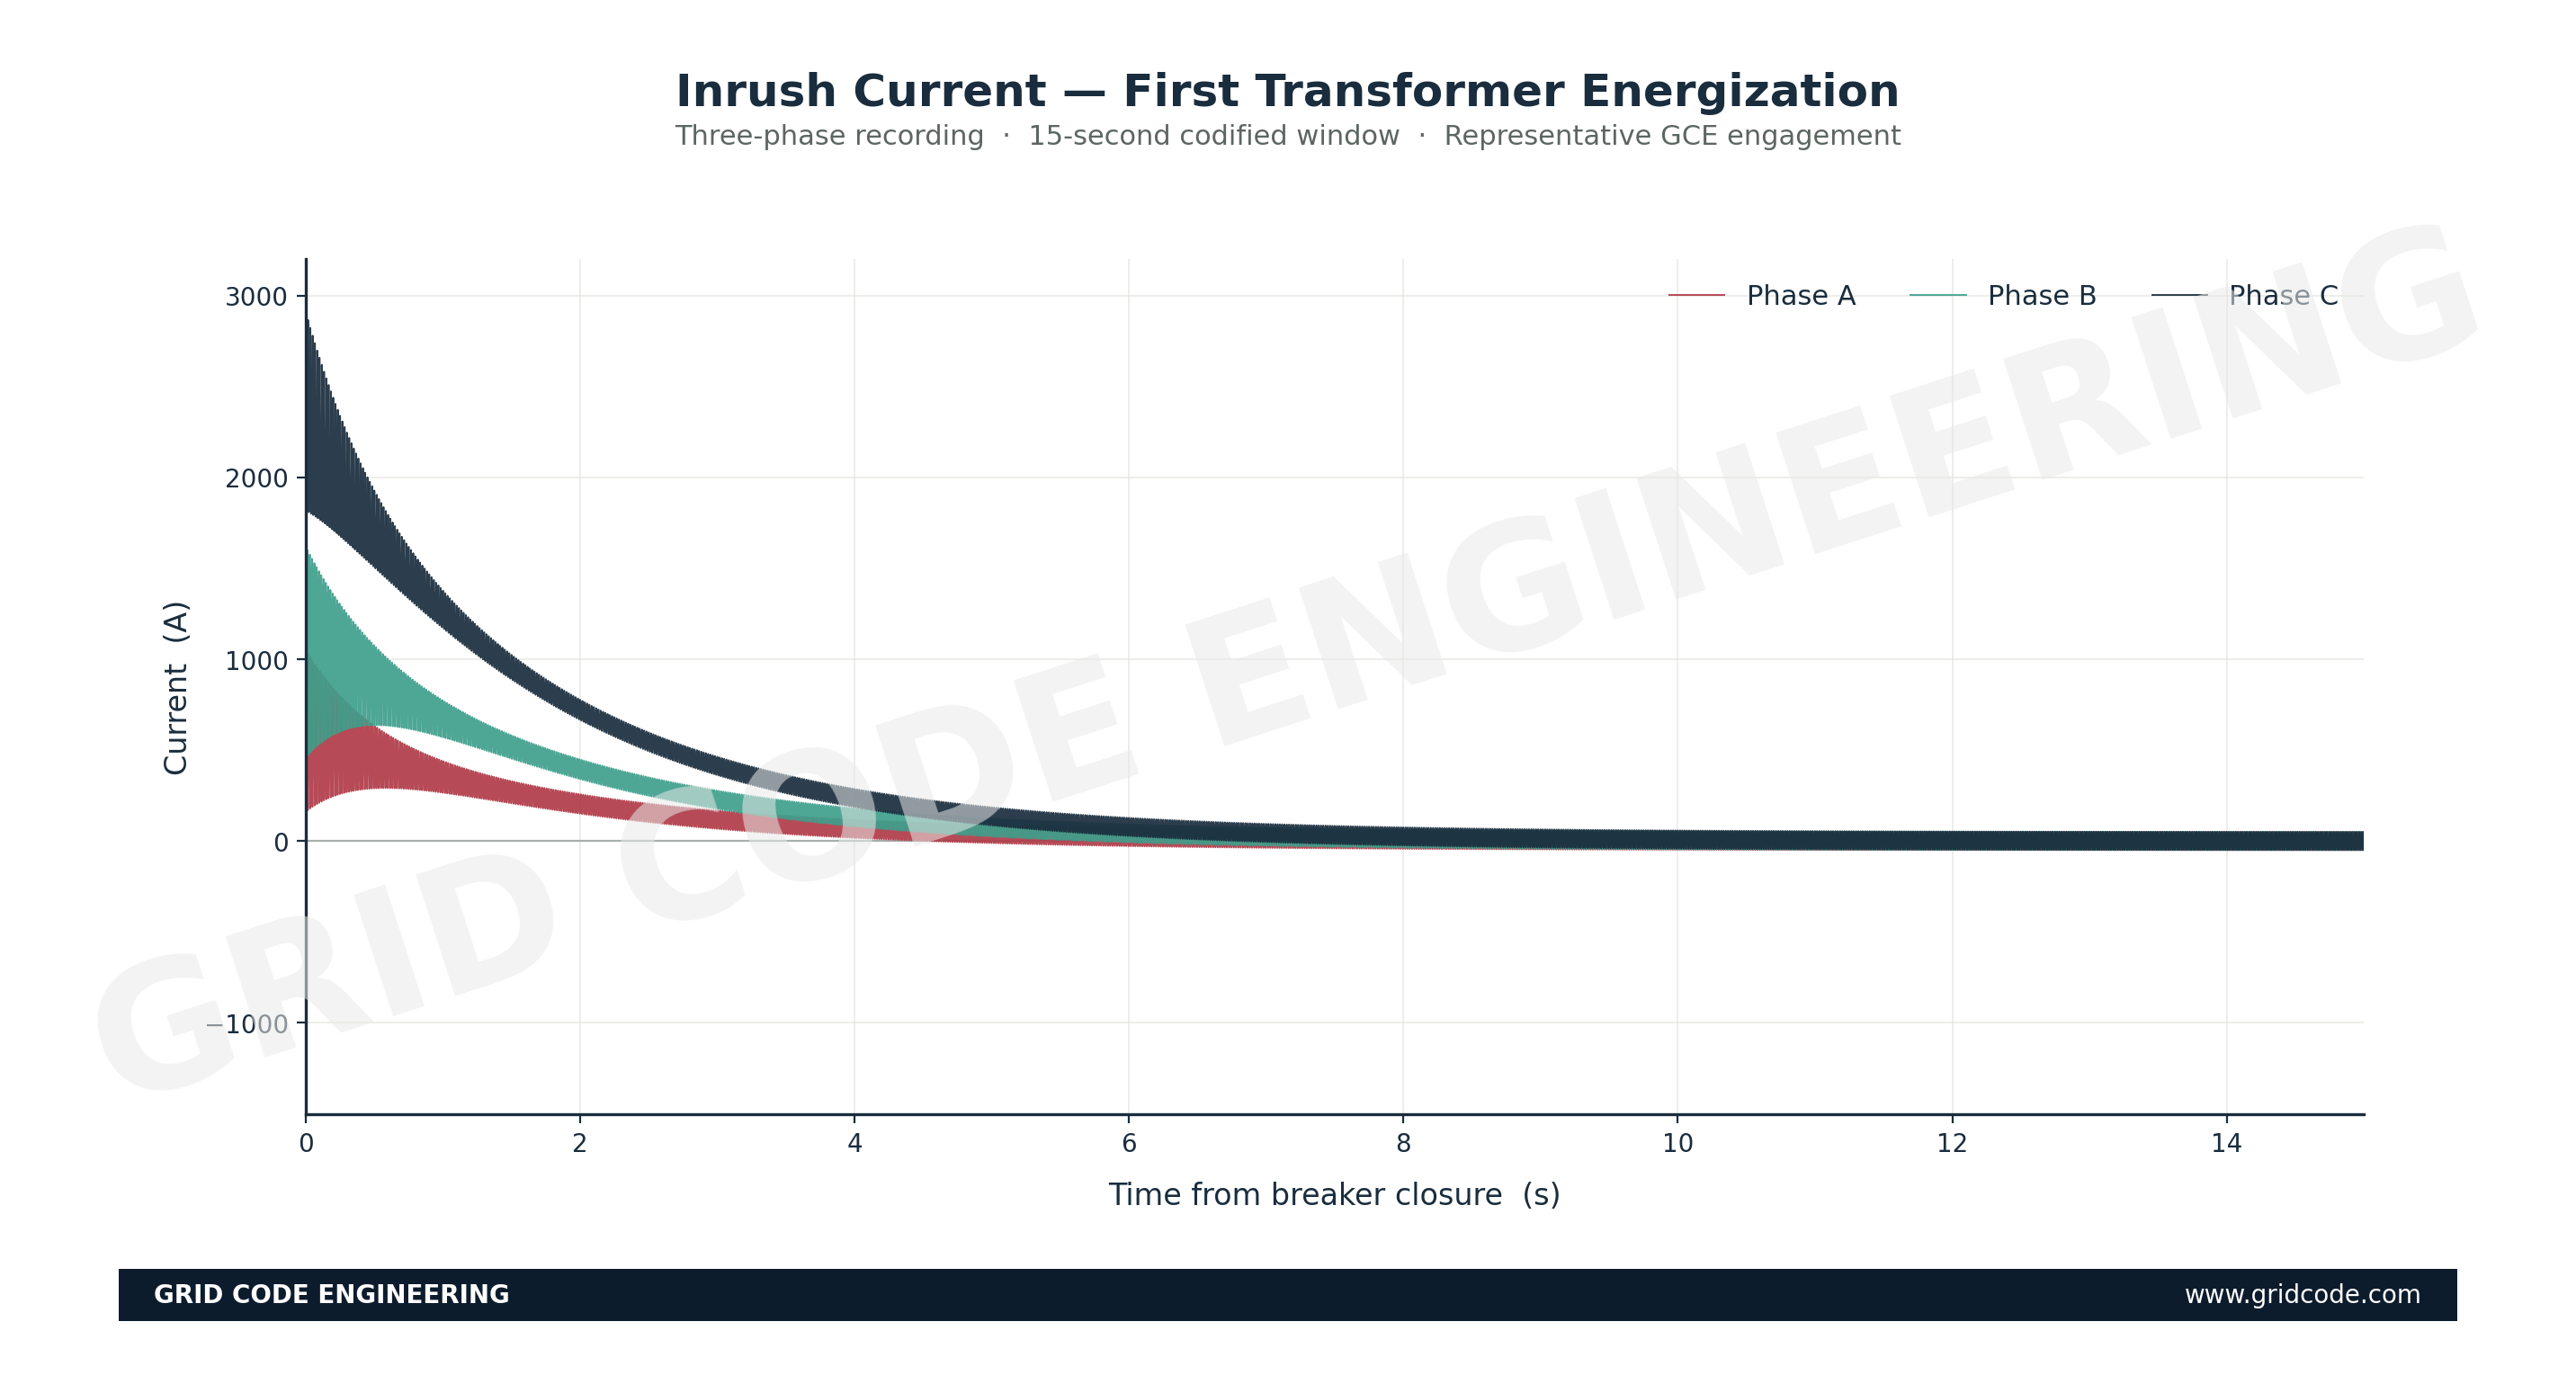
Inrush is one of those phenomena where a number on a page understates what the physics looks like. In one GCE engagement (22 October 2025), a generator step-up transformer energization produced the following on the line-side current measurement:

Phase A peak: +1,131 A, minimum −873 A within the first second. Phase B peak: ~1,850 A (intermediate). Phase C peak: ~2,800 A in the first half-cycle — more than 2.5× the Phase A peak.

The dramatic per-phase asymmetry is the signature of the point-on-wave at which the breaker contacts actually closed. The three phases all see the same network impedance and the same transformer; the difference between Phases A and C in this engagement is entirely a function of when, within the 60 Hz cycle, the contacts made. That asymmetry decays away as the DC component bleeds off — by ~6-8 seconds, all three phases settle into the symmetric steady-state magnetizing current.

Detail view · Phase B

What the deep negative peak looks like up close.

Phase B 1-second close-up of inrush waveform

What the regulator needs to see

A representative grid code commissioning sequence — Mexico's three-stage Código de Red process is one example, but the pattern recurs in Brazil's ONS submódulos, Chile's NTSyCS, and most other jurisdictions — requires, among its final operating-readiness deliverables, the record of first transformer energization showing voltage, current and the relative angle between them, captured from the instant of breaker closure (designated t=0) through the next fifteen seconds, at a minimum sampling rate of sixteen samples per cycle.

The fifteen-second window captures the decaying transient. The sixteen-samples-per-cycle floor is the resolution needed to characterize the peak. The voltage/current/angle simultaneity is what lets a reviewer reconstruct what actually happened on the busbar.

Why the recorder spec is where field campaigns fail

Most projects walk into first energization with one of three recorder setups, two of which are not adequate. SCADA refresh rates are typically 1 second — far too slow. A standard digital fault recorder configured for fault duty has the wrong trigger logic and the wrong window. The adequate setup is a high-speed transient recorder configured specifically for this measurement — typically 256 samples per cycle or higher, continuous recording for the full fifteen seconds, GPS-synchronized timestamping.

Substation interfaceThe site where first-energization records are captured

Pre-energization checklist · Sign-off required

Seven verifications that take fifteen minutes — and the difference between a clean record and an expensive phone call.

/ 01 · GPS sync

Recorder, breaker auxiliary, and any parallel relay records all GPS-synchronized.

Without GPS sync, the t=0 instant becomes a negotiated estimate after the fact rather than a measured fact.

/ 02 · Voltage channels

Line-side bushings, not the busbar.

The line-side is what the transformer actually sees. The busbar can be confounded by other switching transients.

/ 03 · Continuous recording

At least two cycles of pre-trigger buffer.

Recorder in continuous capture across the full window. Triggering on closure itself is a single point of failure.

/ 04 · Independent power

Recorder not on the same auxiliary supply as anything being energized.

A momentary dip during the inrush event that takes the recorder offline mid-capture is the worst possible avoidable failure.

/ 05 · CT polarity

Confirmed correct phase, correct polarity, correct ratio.

CTs at high transient ratio, or Rogowski coils with integrator electronics. Standard CTs saturate at the peak.

/ 06 · Channels live

All six (or more) channels show non-zero baseline noise.

Confirms the channels are actually wired and reading. Easy to miss until the record comes back blank.

/ 07 · Storage verified

Empty drive, capacity confirmed sufficient.

Trivial step, trivial cost. The opposite of trivial when the recording fails to write to a full disk.

All seven · signed off on paper

Before the breaker closes.

The difference between a defensible dossier line item and a regulator query that takes weeks to resolve.

What to extract from the record

After the event, the deliverable to the dossier is not the raw waveform file alone. It is a plot of the three-phase currents over the full fifteen-second window with t=0 annotation, a zoomed plot of the first ten cycles showing peak magnitudes and second-harmonic content, a plot of the voltage waveforms with matching annotations, a tabular extraction of per-phase peak current values and decay times, and the raw waveform file, time-stamped and traceable to the recorder's calibration record. That last item is what makes the record defensible under audit years later.

First energization is the one event in a plant's life where the recorder spec is irreplaceable. Sixteen samples per cycle is the regulatory floor; treat it as the floor and use faster. Fifteen seconds is the window; capture all of it continuously, not on a fault-recorder trigger. GPS-sync everything. Verify on paper before the breaker closes.

Verify against published regulation

The minimum sampling rate codified for first-energization records, the required recording-window duration, and the list of required channels should be verified against the specific regulatory framework applicable to the project (Manual de Interconexión in Mexico, Submódulo 2.10 in Brazil, NTSyCS articles in Chile, etc.). The sixteen-samples-per-cycle and fifteen-second figures used in this post are drawn from our Mexican practice and represent solid engineering practice generally; confirm they match the canonical codified values for the jurisdiction in question.

Have a plant approaching commercial operation?
Let’s discuss your scope.