Independent grid code testing · For global utilities, IPPs and OEMs
Home/ Behind the Grid/ Plant performance · Compliance filings/ Heat consumption curves

Heat consumption curves: where generation costs actually come from.

When a generator submits its variable-cost offer into a regulated wholesale electricity market, the cost is not invented — it is derived from a measured heat consumption curve produced under field test. The curve is what links physical fuel use to dispatch economics.

Three forms of heat consumption curve: raw / specific heat rate / piecewise-linear
Three forms of the same measurement · Raw curve → Specific heat rate → Piecewise-linear submission

In steady-state operation a 980 MW combined-cycle plant is, broadly, a known quantity. Heat rate falls in a narrow band. The dispatcher knows what to expect.

The cost offer that earns the plant dispatch revenue is not a commercial judgment — it is a physical measurement. Specifically, it is derived from the plant's heat consumption curve, the same artifact in every wholesale market that uses merit-order dispatch.

That relationship is not assumed from OEM data. It is measured under field conditions, validated against ASME PTC test protocols, and submitted as part of the market-entry dossier — the MEM migration dossier in Mexico, equivalent submissions elsewhere.

What the curve is, in physical terms

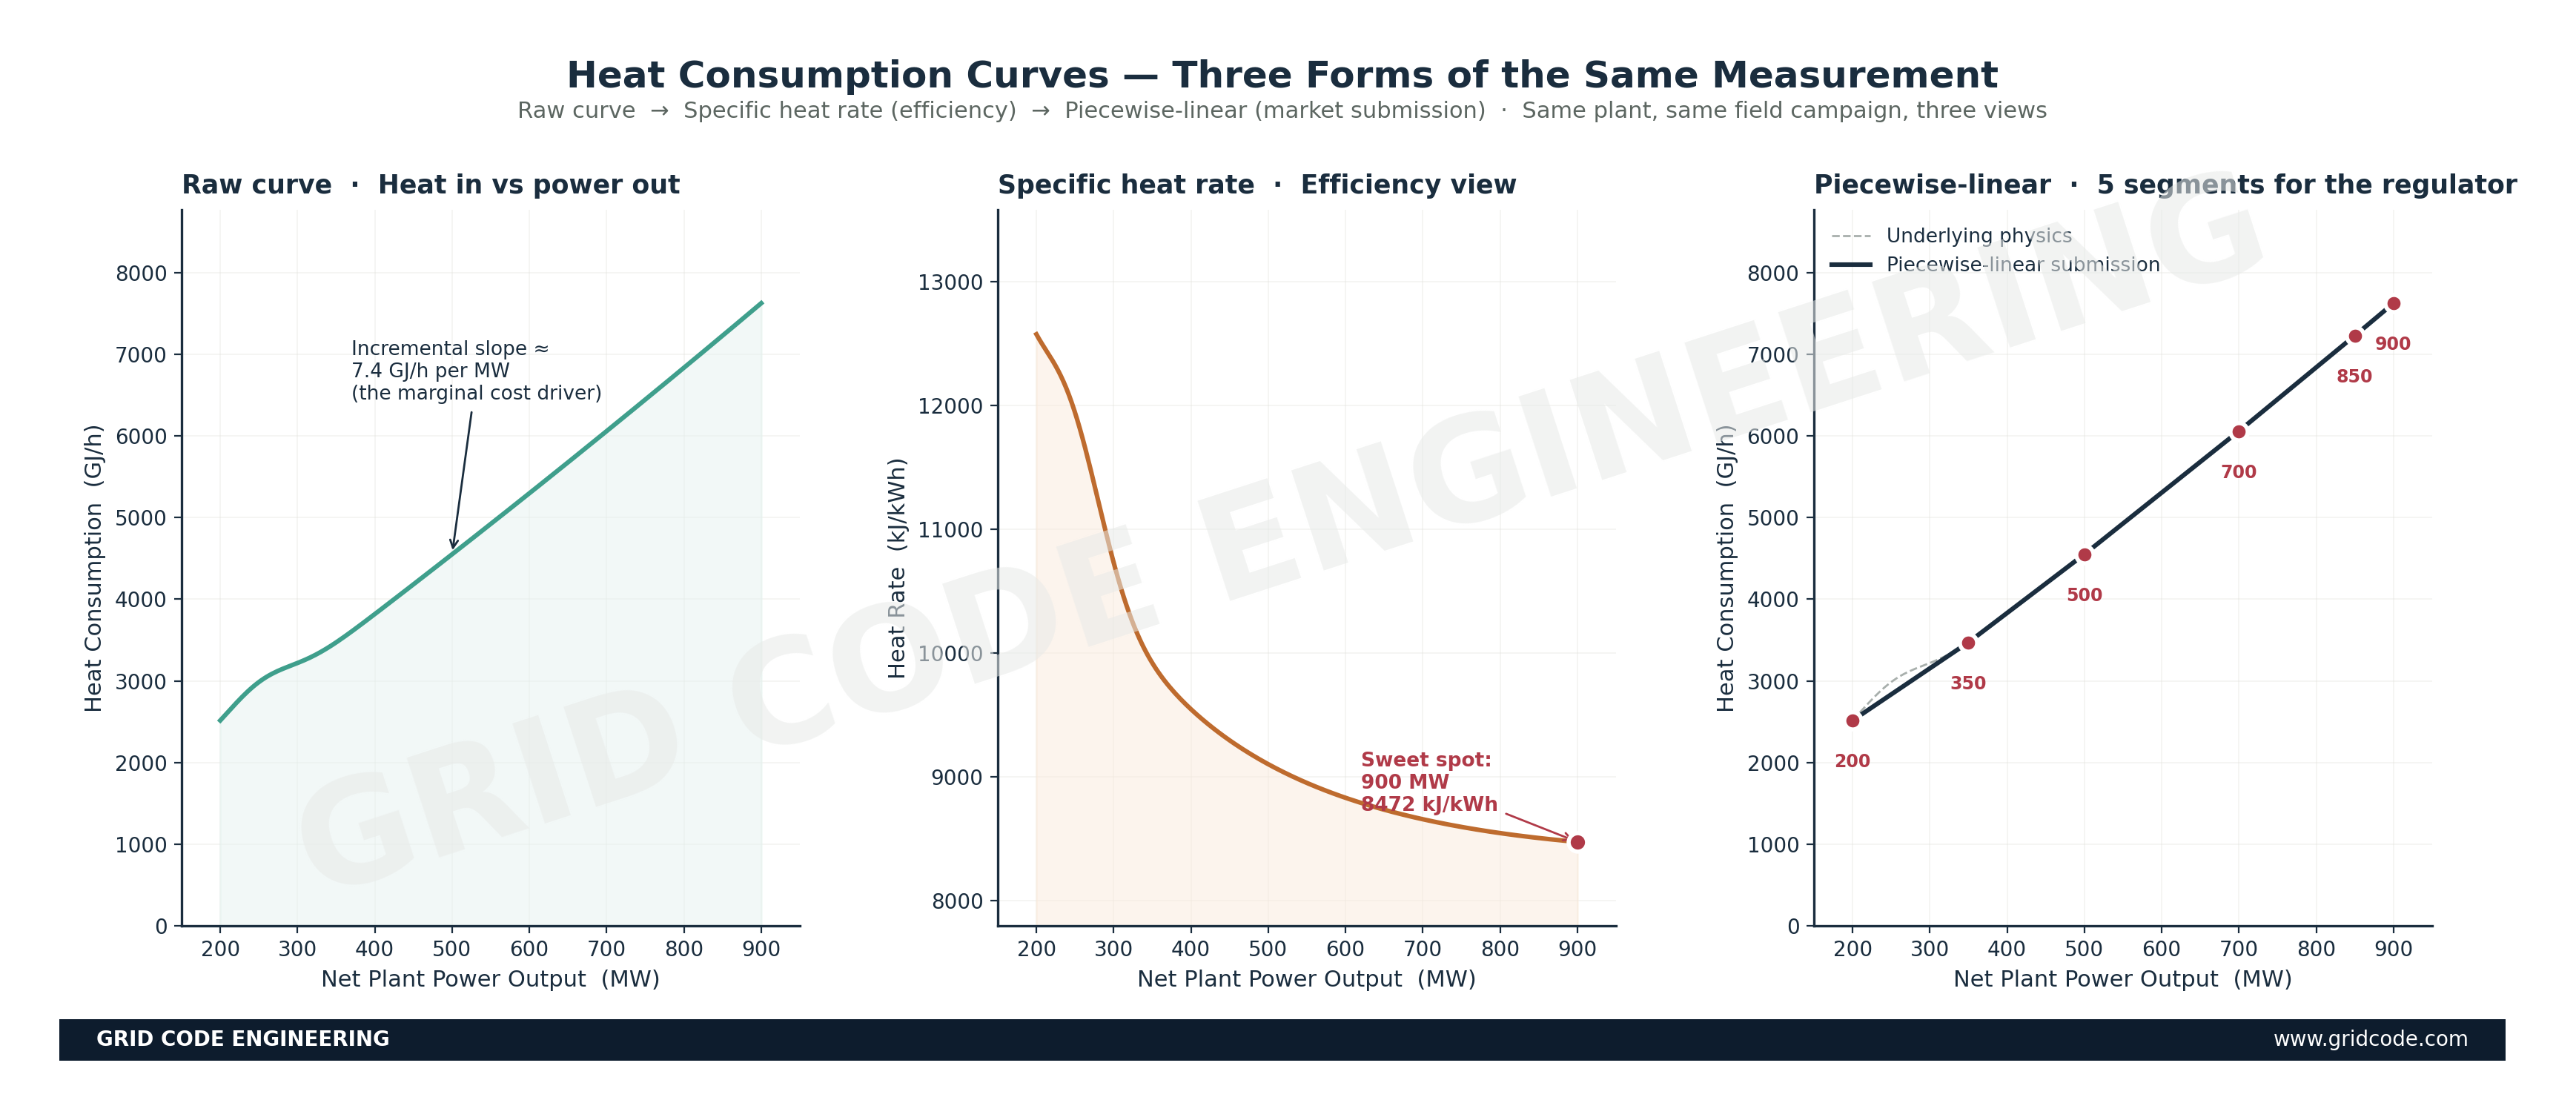
The raw curve plots GJ/h of fuel input against net MW output. For most thermal plants, the curve is approximately linear above minimum stable load. The specific heat rate curve plots kJ/kWh against net MW — the U-shape that reveals efficiency. The piecewise-linear curve is the regulator-facing artifact: 3 to 6 linear segments across the operating range, with constant incremental heat rate per segment.

From measurement to dispatch

How the curve becomes a cost offer.

Incremental heat rate×fuel cost
+variable O&M+emissions cost

The first term — incremental heat rate (GJ/MWh) — comes directly from the heat consumption curve. The other three terms are jurisdiction-specific, but the structure is the same in every merit-order market — Mexico's MEM, Brazil's CCEE, Chile's spot market, PJM, ERCOT, the European zonal markets. The curve determines whether the plant gets dispatched.

Combined cycle plantThe full system that the heat-rate curve characterizes — gas turbine, HRSG and steam tail

Why the regulator measures, not estimates

OEM guarantees are at design conditions. The published heat rate assumes a specific ambient temperature, specific fuel composition, specific cooling-water temperature, specific equipment-as-new condition. None of those conditions match the plant's actual operating environment over the life of the asset.

OEM guarantees are for performance acceptance, not dispatch. The OEM contract specifies a heat rate at one operating point. Dispatch economics need the curve across the full operating range.

OEM guarantees are not independent. Regulated wholesale markets require evidence produced under independent test, with measurement traceability and methodology that the regulator can audit.

How the test is structured

The heat consumption test is typically run as a series of steady-state test points distributed across the plant's operating range. Each test point holds the plant at a defined output for a measurement window of typically two to four hours, during which net electrical output, fuel flow, fuel calorific value, ambient conditions, cooling-water temperature, auxiliary load consumption, and steam conditions are all measured.

A simple-cycle gas turbine plant might be tested at 5 to 8 points. A combined-cycle plant typically needs 8 to 15 — the part-load behavior of the steam bottoming cycle changes the overall heat rate in ways that simple-cycle curves do not capture.

Five field-test failure modes.

Each produces a mildly wrong curve that compounds over years of dispatch.

01

Test points clustered at convenient ranges

All points in the 60–100% load region. Low-load behavior gets extrapolated. Used to bid into low-demand hours where errors compound.

02

Insufficient steady-state hold time

Plants take longer to reach steady state than 90-minute holds. Combined-cycle steam mass extends the time constant.

03

Fuel sampling at wrong frequency

Gas composition varies through the day with blending. A single sample at the start of a multi-hour test point is not adequate.

04

Auxiliary load measurement errors

Incomplete metering of cooling fans, lube-oil, feedwater pumps. "Net" output overstated. Heat rate understated.

05

Fuel meter calibration drift

The single most consequential measurement. Calibration drift = systematic curve error. Verify immediately before campaign, not on OEM cycle.

The relationship between fuel input and electrical output is physics. The curve is the measurement of that physics. The dispatch is the consequence. The revenue is the dispatch.

The plant's revenue model lives or dies by what gets measured during a few hundred hours of test campaign, conducted under specific protocols, with specific instrumentation, and documented to a specific standard. Treating that campaign as a checkbox is among the most expensive habits in plant operations.

Verify against published regulation

The test protocols required for the heat consumption curve (typically referencing ASME PTC standards by article in the operation manual), the required number of test points and minimum hold duration, the methodology for piecewise-linear conversion required for market submission, and the timeframe within which re-verification is required after major maintenance should be confirmed against the specific regulatory framework applicable to the project. The framework described here is the general PTC-based methodology, universal across jurisdictions; specific regulatory parameters should be confirmed for the wholesale market in question.

Plant entering a wholesale market? Let’s discuss your heat-rate campaign.